.svg)
What 66.4% utilization actually means in 2026


Your senior developer billed 32 hours last week. Your account manager logged 28. Your creative director tracked 15. You calculated the team average: 68% utilization. Is that healthy or hemorrhaging profit?
Here's the problem: you're comparing a firm-wide average against benchmarks designed for individual producers. That 68% might reflect excellent performance masked by structural math. Or it might signal a pipeline crisis you're not catching.
Industry-wide billable utilization dropped to 66.4% in 2025, down from 68.9% in 2024, according to NetSuite. But that aggregate number hides the role-specific variance that determines whether your agency is profitable or broken. Understanding billable utilization rate benchmarks by role is the only way to diagnose what your numbers actually mean.
The agency utilization rate 2026 benchmarks that matter
Producers should hit 75-85% billable time weekly. That's designers, developers, strategists, the people whose work gets invoiced. Iota Finance data shows these role-specific targets:
- Account managers: 60-70%
- Directors: 30-40%
- Senior strategists: 75-85%
- Junior designers: 75-85%
Those aren't aspirational targets. They're operational thresholds that define the optimal utilization rate agencies need to maintain profitability.
Harvest benchmarks show marketing agencies specifically target 70-80% utilization rate average. This translates to 30-32 billable hours in a 40-hour week. But here's what that aggregate billable hours benchmark masks: the utilization rate by role variance that determines actual profitability.
A senior strategist billing 80% of their time creates very different margins than a junior designer billing 80%. The strategist's rate is $180/hour. The designer's is $95/hour. Same utilization percentage, 89% difference in revenue contribution. That's why firm-wide averages mislead you into thinking performance is uniform when profitability is anything but.
Why firm-wide rates run lower
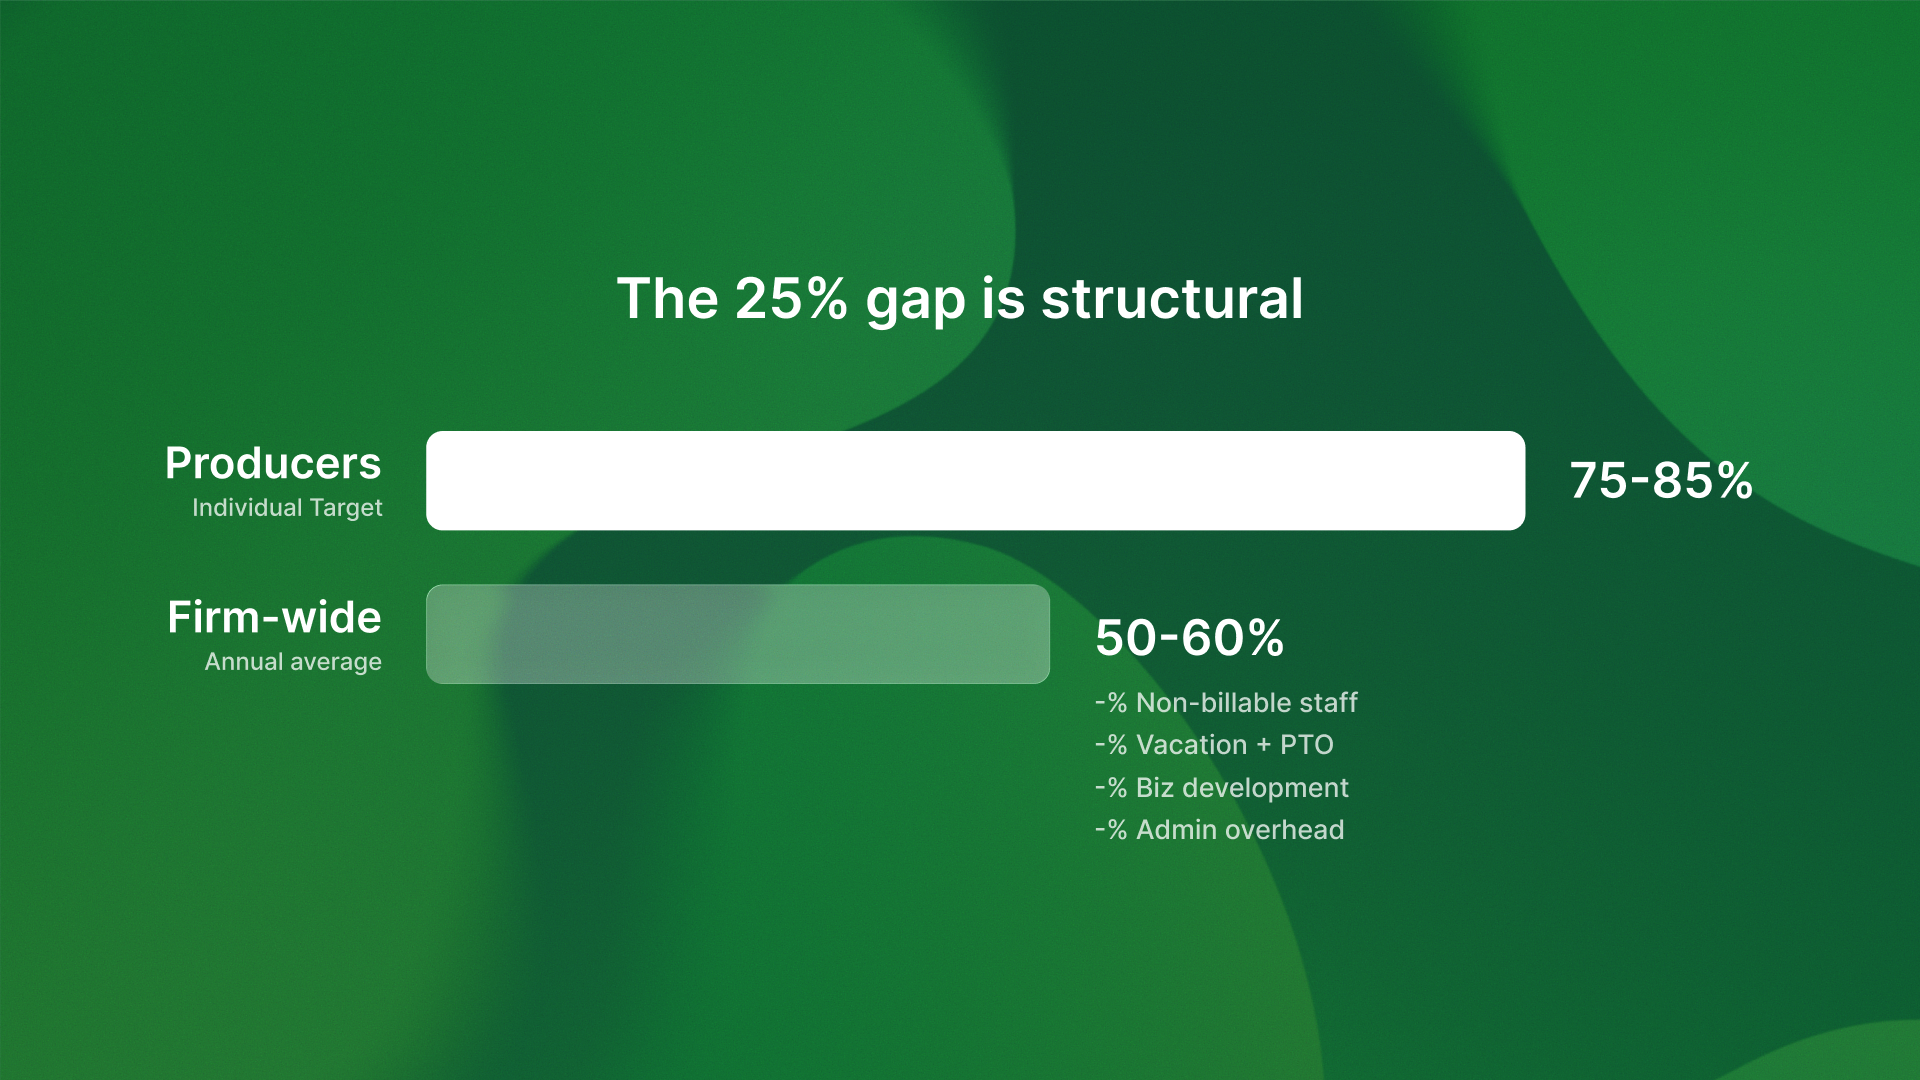
Your producers hit 80% utilization. Your firm-wide rate sits at 55%. That's not a performance problem. That's structural reality.
Firm-wide annual targets sit around 50-60% when you account for these factors:
- Non-billable staff
- Vacation time
- Business development
- Administrative overhead
According to Iota Finance, a creative director billing 35% of their time is not underperforming. This is true if they land new business and mentor junior staff. An operations manager billing zero hours isn't a margin drag if they're keeping projects profitable.
The gap between individual producer targets (75-85%) and firm-wide averages (50-60%) creates widespread confusion. Agency leaders see 55% firm-wide utilization. They compare it against a 75% benchmark meant for individual producers. They assume their team is failing. They push harder when the issue is math, not motivation.
This is like the challenge covered in fractional versus full-time hiring decisions. Role criticality and workload predictability help determine the right staffing model. A fractional CMO billing 15 hours a week at 40% use may add more value than a full-time generalist at 75%. Context determines whether the number signals health or hemorrhage.
What low utilization actually signals
Pipeline problems
Producers consistently below 75% means you have a pipeline problem. Not enough client work to fill billable capacity. That's a sales intervention, not an operational fix. When deciding between fractional specialists and full-time hires, utilization patterns reveal whether workload justifies permanent headcount or variable capacity.
Staffing mix or workflow efficiency issues
Producers above 75% but firm-wide rates low means you have a staffing mix or workflow efficiency problem. Too many non-billable roles relative to producers. Or billable staff spending too much time on internal work. That's an operational structure issue. Platforms like Timecapsule can help diagnose it. They show where non-billable time builds up during project work.
The distinction matters because the fixes are completely different. A demand problem requires business development and potentially thought leadership strategies that drive pipeline. A workflow problem requires process automation or role restructuring. Misdiagnosing which problem you have costs you months of wrong interventions.
Misclassification of billable work
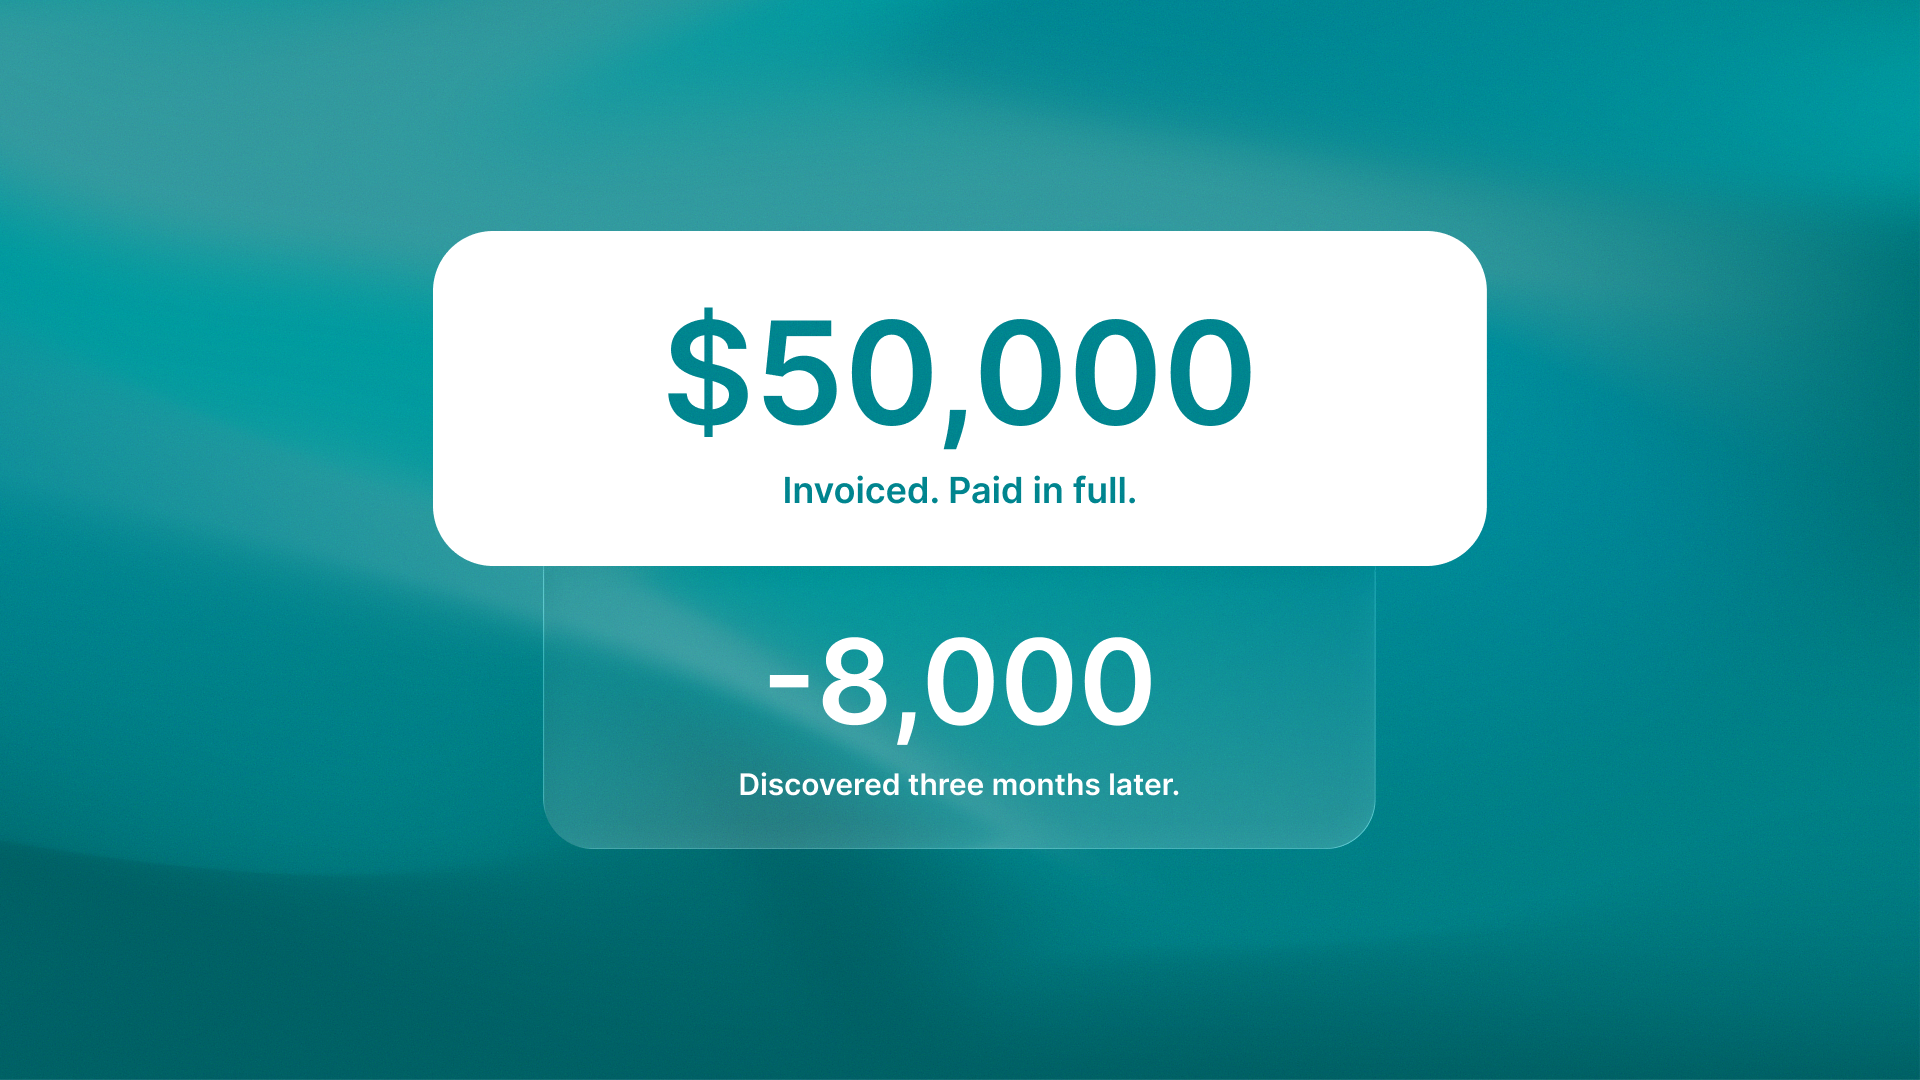
Agencies often misclassify billable project management work as relationship building, creating artificial utilization problems. According to Timecapsule research, this misclassification costs agencies $32,500+ annually per project manager. That's not low utilization. That's invisibility into what's actually billable.
The structural cost of misunderstanding utilization
When agencies use firm-wide averages as performance targets for each person, they set standards that are hard to meet. These standards can lower morale. They can also lead to hiring that is not needed. You see 55% firm-wide utilization and assume you need more producers to fill capacity. You hire two junior designers. Utilization drops to 48% because you've added billable capacity without adding client demand.
The hiring decision makes the problem worse, not better. This is like measuring AI agent ROI incorrectly, which can lead firms to reject projects with 171-192% returns. You're applying the wrong formula to the wrong problem, then acting on the flawed analysis.
Or you push producers to bill more hours when they're already at 80% capacity. Utilization climbs to 88%. Quality drops. Client satisfaction tanks. Scope creep accelerates because exhausted teams skip clarification conversations. You've optimized the wrong metric and damaged the business in the process.
The competitive advantage
The 75% threshold isn't a universal target. It's a producer-level benchmark. Firm-wide rates will always run lower because of structural realities: non-billable roles, time off, business development. The competitive advantage belongs to agency leaders who know what number they see. They also know what it should be for that role or context.They know what action the gap needs.
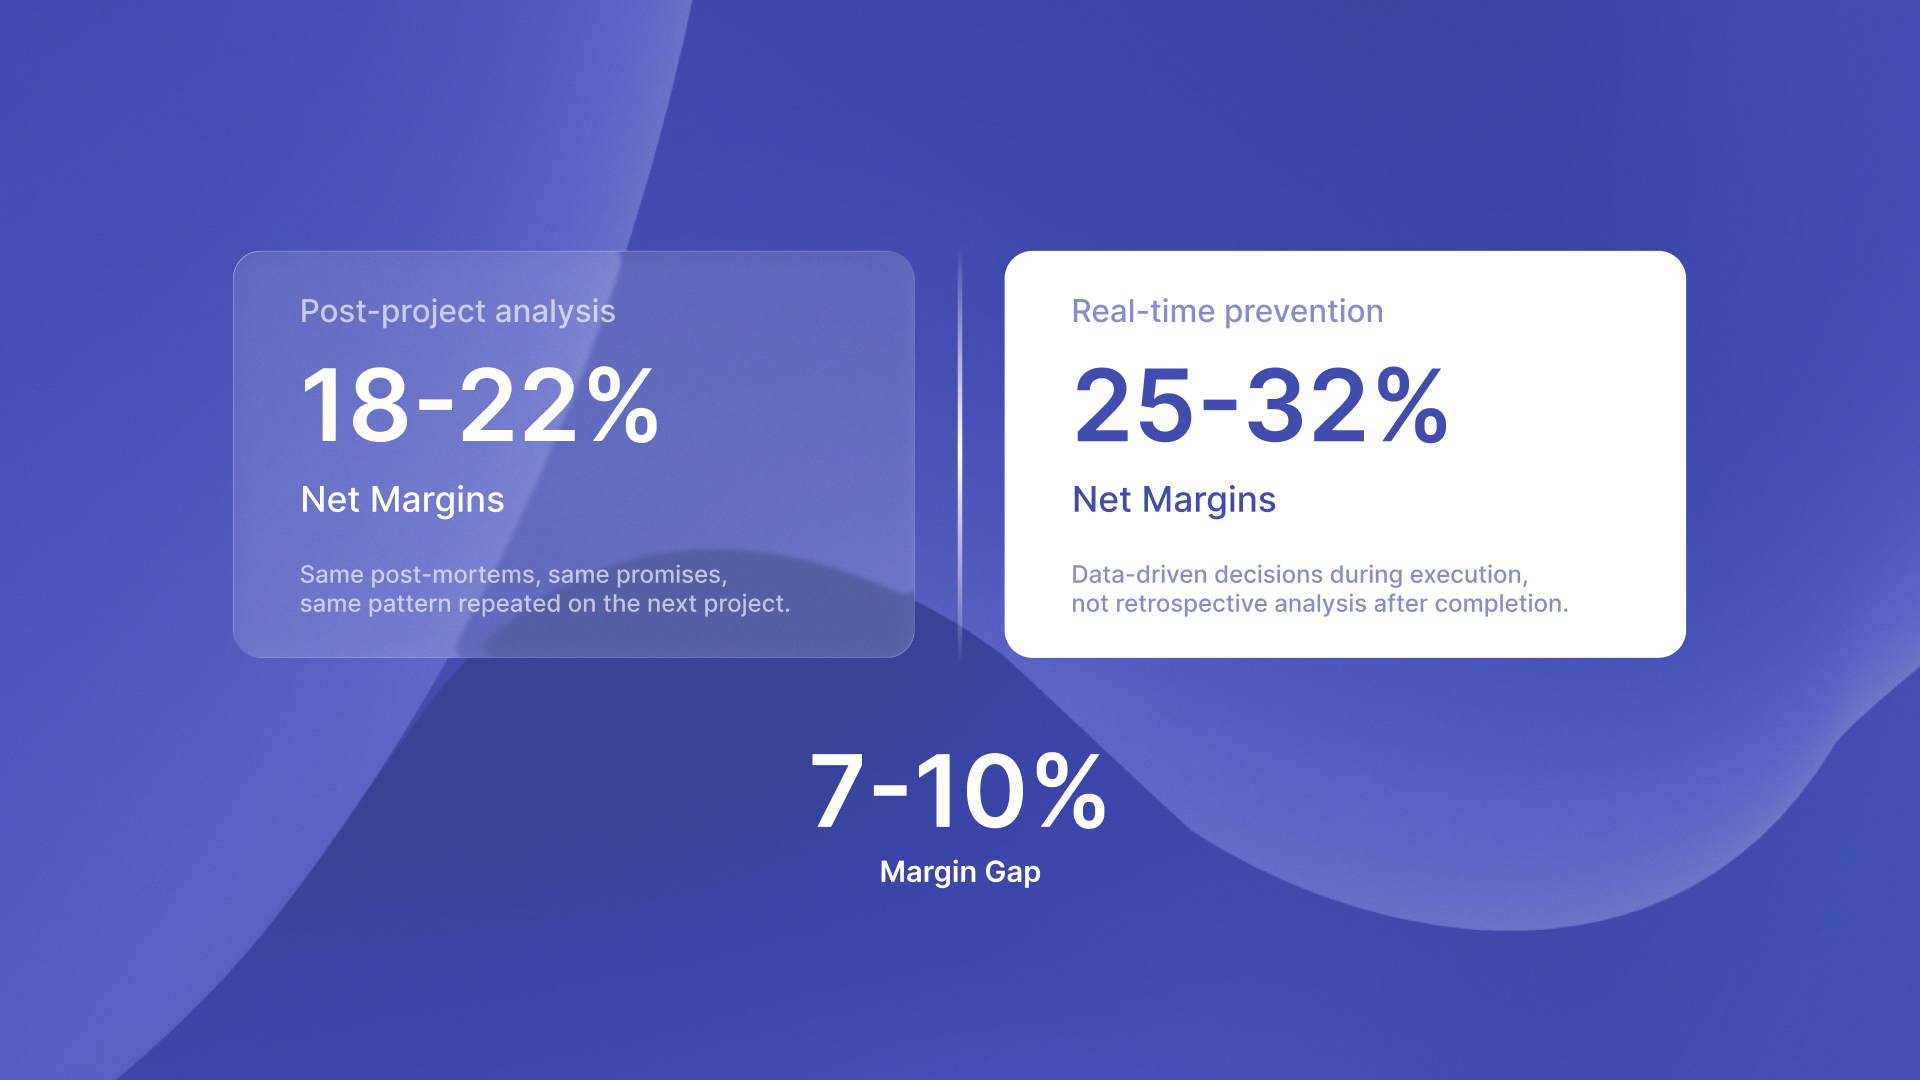
That's not just tracking hours. That's operational intelligence. Tools like Timecapsule offer real-time profit dashboards. They help you shift from post-project reviews to in-flight course corrections. You see utilization gaps while you can still fix them, not after the margin damage is permanent.
Similar to how fractional QA scales differently than full-time testing capacity, utilization benchmarks mean different things for different roles and contexts. A fractional CFO billing 12 hours weekly might be exactly right. A full-time senior developer billing the same hours signals a pipeline collapse.
Measurement clarity determines profit outcomes. Know your billable utilization rate benchmarks by role. Track the right numbers. Fix the actual problem. Ready to see where your team's time actually goes? Start tracking with real-time profitability dashboards.