.svg)
Why post-project profitability analysis is too late to save your margins

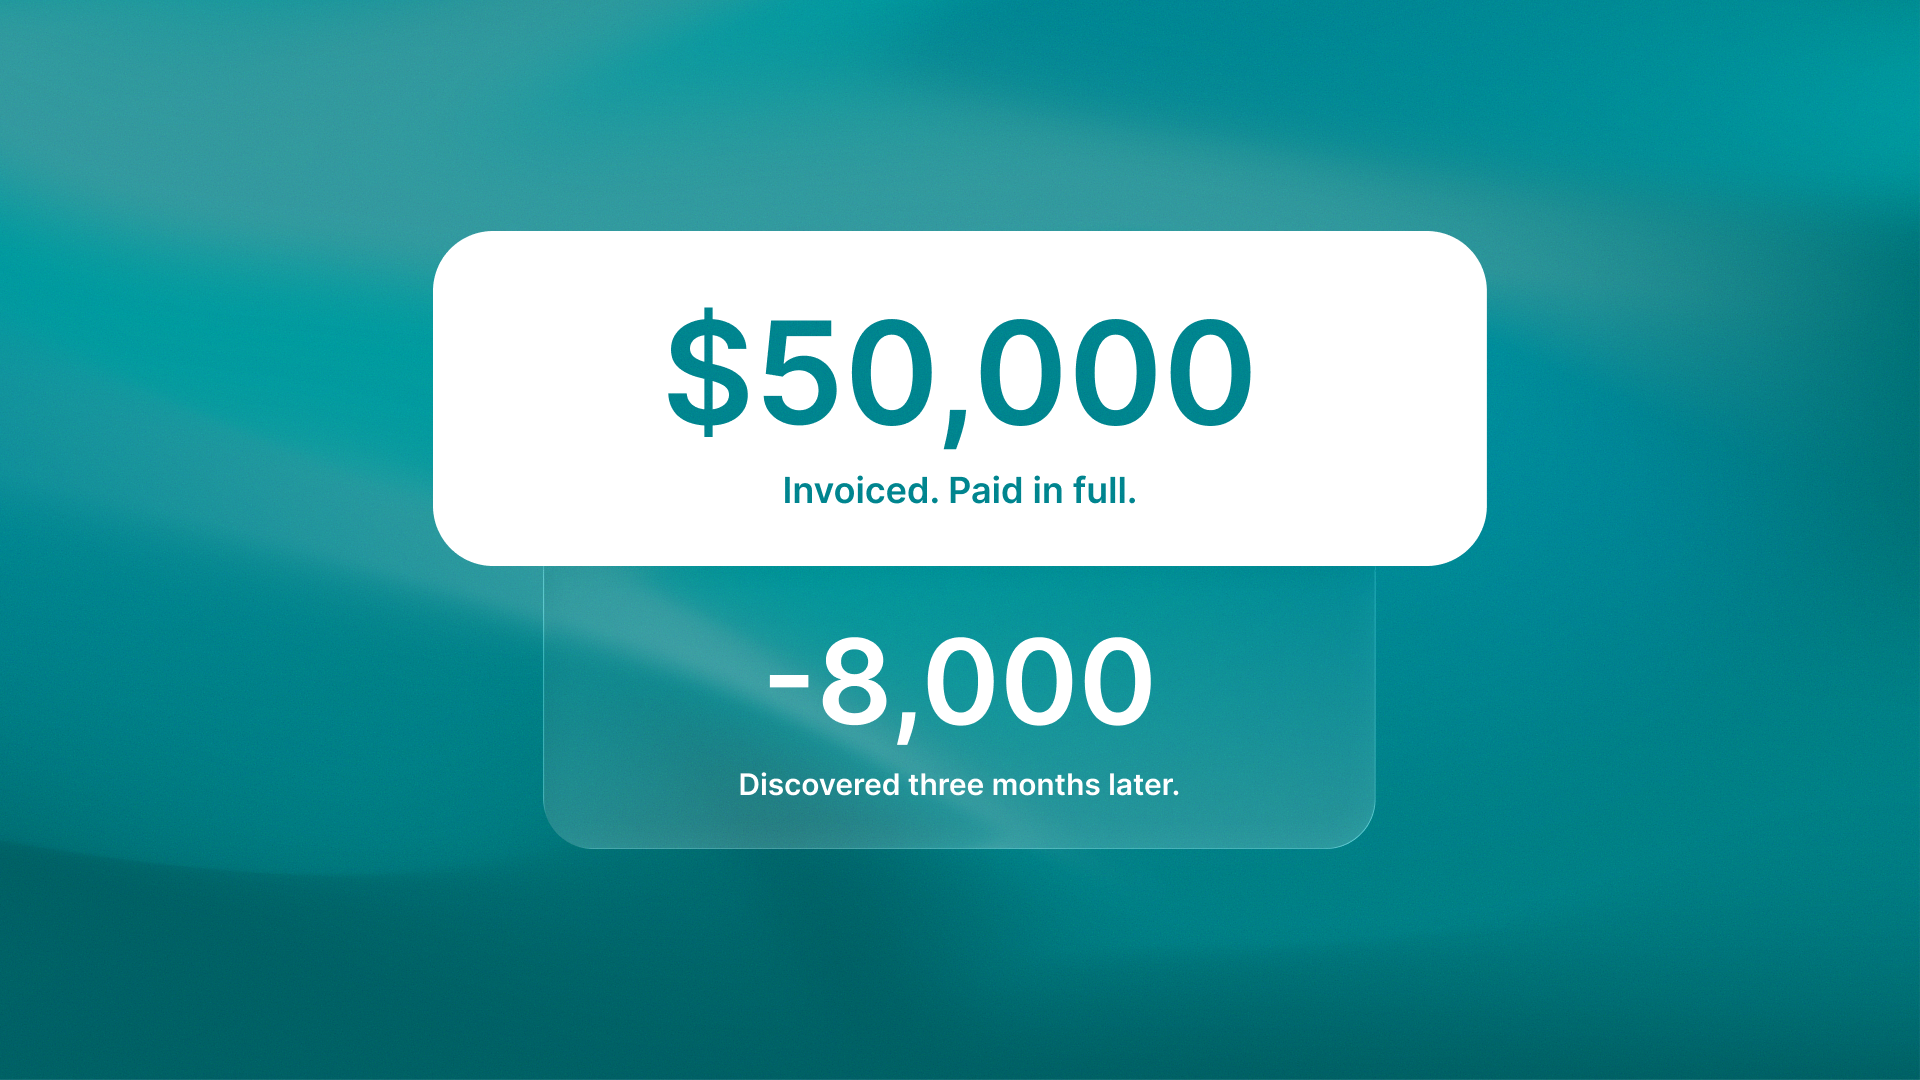
Your agency just closed a $75,000 project. Twelve weeks of work. Client paid on time. Two months later, your accountant tells you the project lost $8,000.
How did that happen?
You tracked hours. You invoiced on schedule. You delivered quality work. But somewhere between kickoff and completion, profitability leaked out, and you didn't see it until the damage was permanent.
That's not a tracking problem. That's a timing problem.
Post-project profitability analysis is an autopsy, not a diagnosis. By the time you spot margin erosion, the money is already spent. The choices that cut your profit are already locked in history.
High-performing agencies don't discover profitability problems after projects close. They prevent issues during execution by tracking three real-time metrics that predict outcomes before it is too late.
The margin gap that separates 7-figure from 8-figure agencies
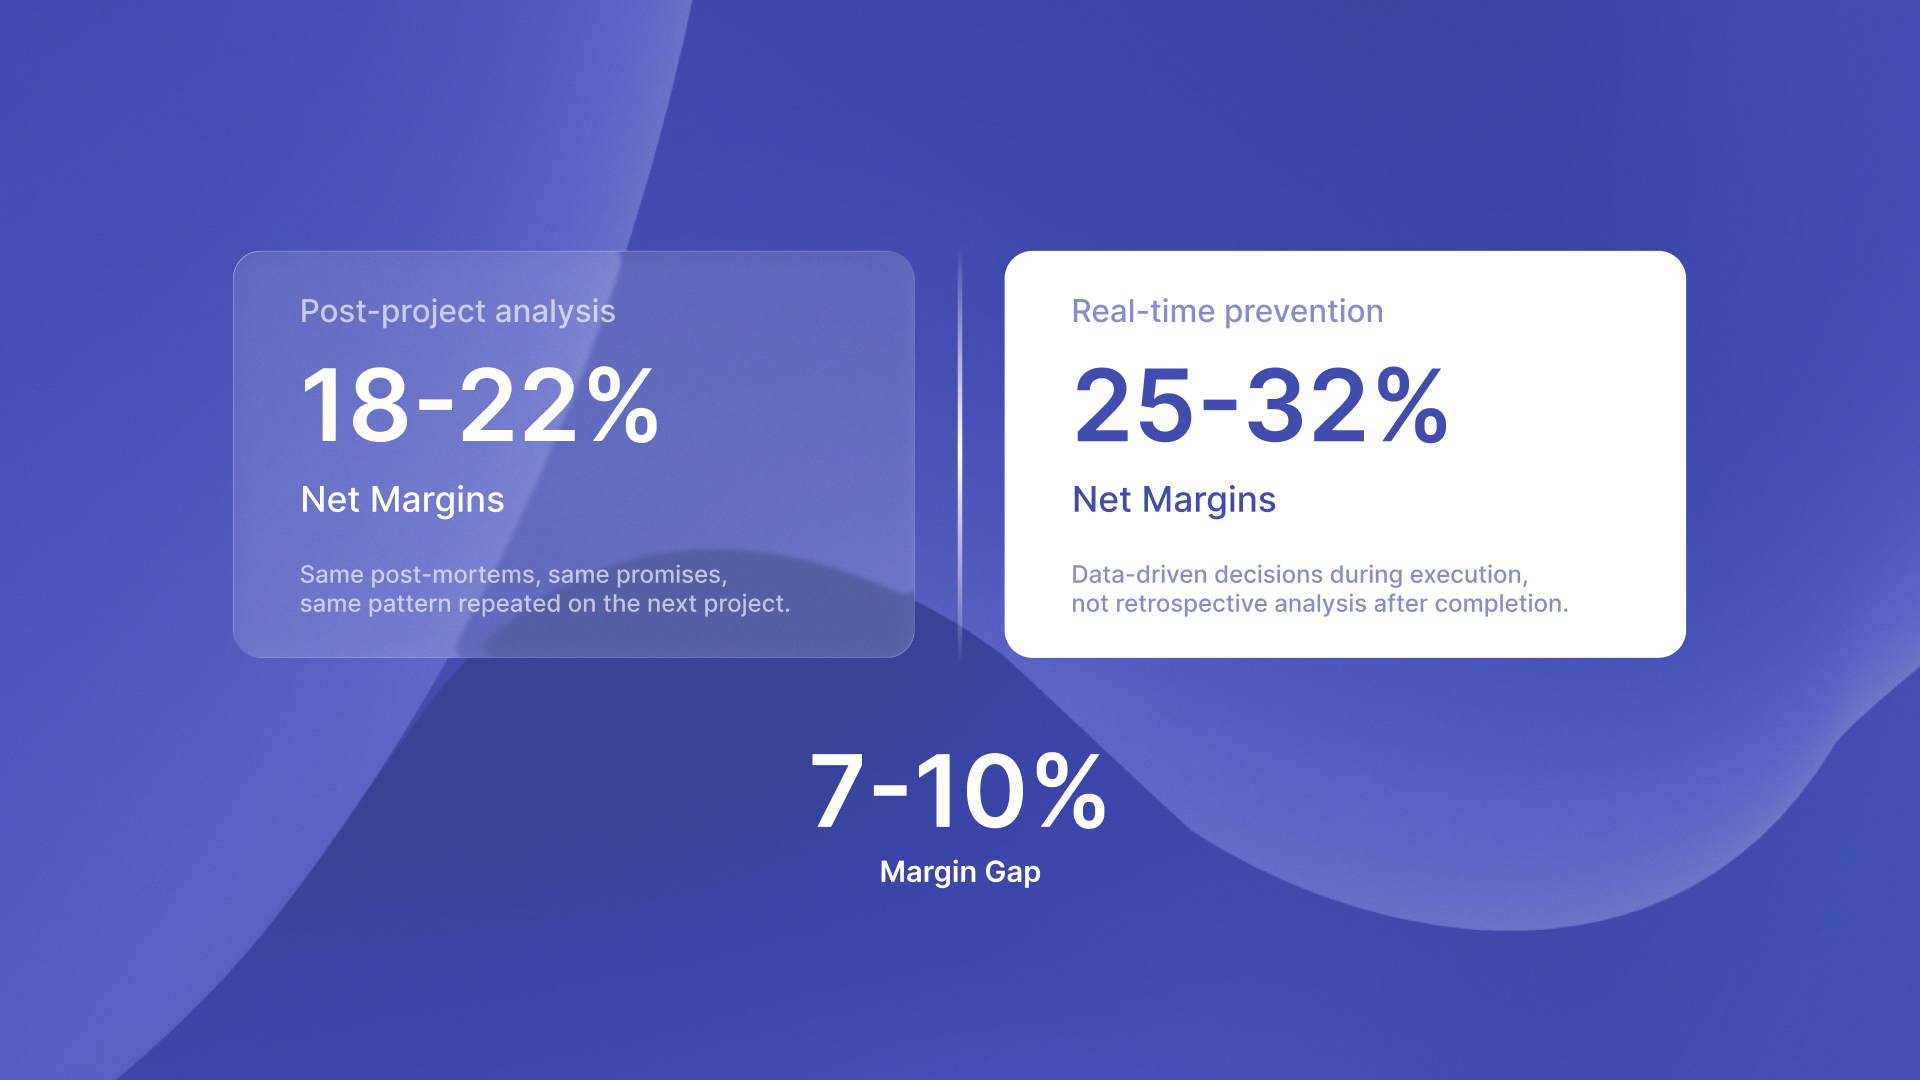
8-figure agencies maintain 25-32% net margins while 7-figure agencies average 18-22%, according to Predictable Profits' 2025 Agency Growth Benchmark. That 7-10 percentage point difference isn't driven by better clients or higher rates.
It's driven by real-time project profitability tracking that enables data-driven decisions during execution, not retrospective analysis after completion.
The agencies stuck at 18-22% margins run the same post-mortems and retrospectives. They promise the same process improvements. Then they repeat the pattern on the next project because they're analyzing outcomes instead of monitoring leading indicators.
The three metrics that predict profitability during execution
Time tracking tells you what happened. Real-time profitability tracking tells you what's happening now. The difference between those two statements is the difference between discovering a problem and preventing it.
Agencies maintaining 25-32% net margins monitor three specific metrics while projects are in flight:
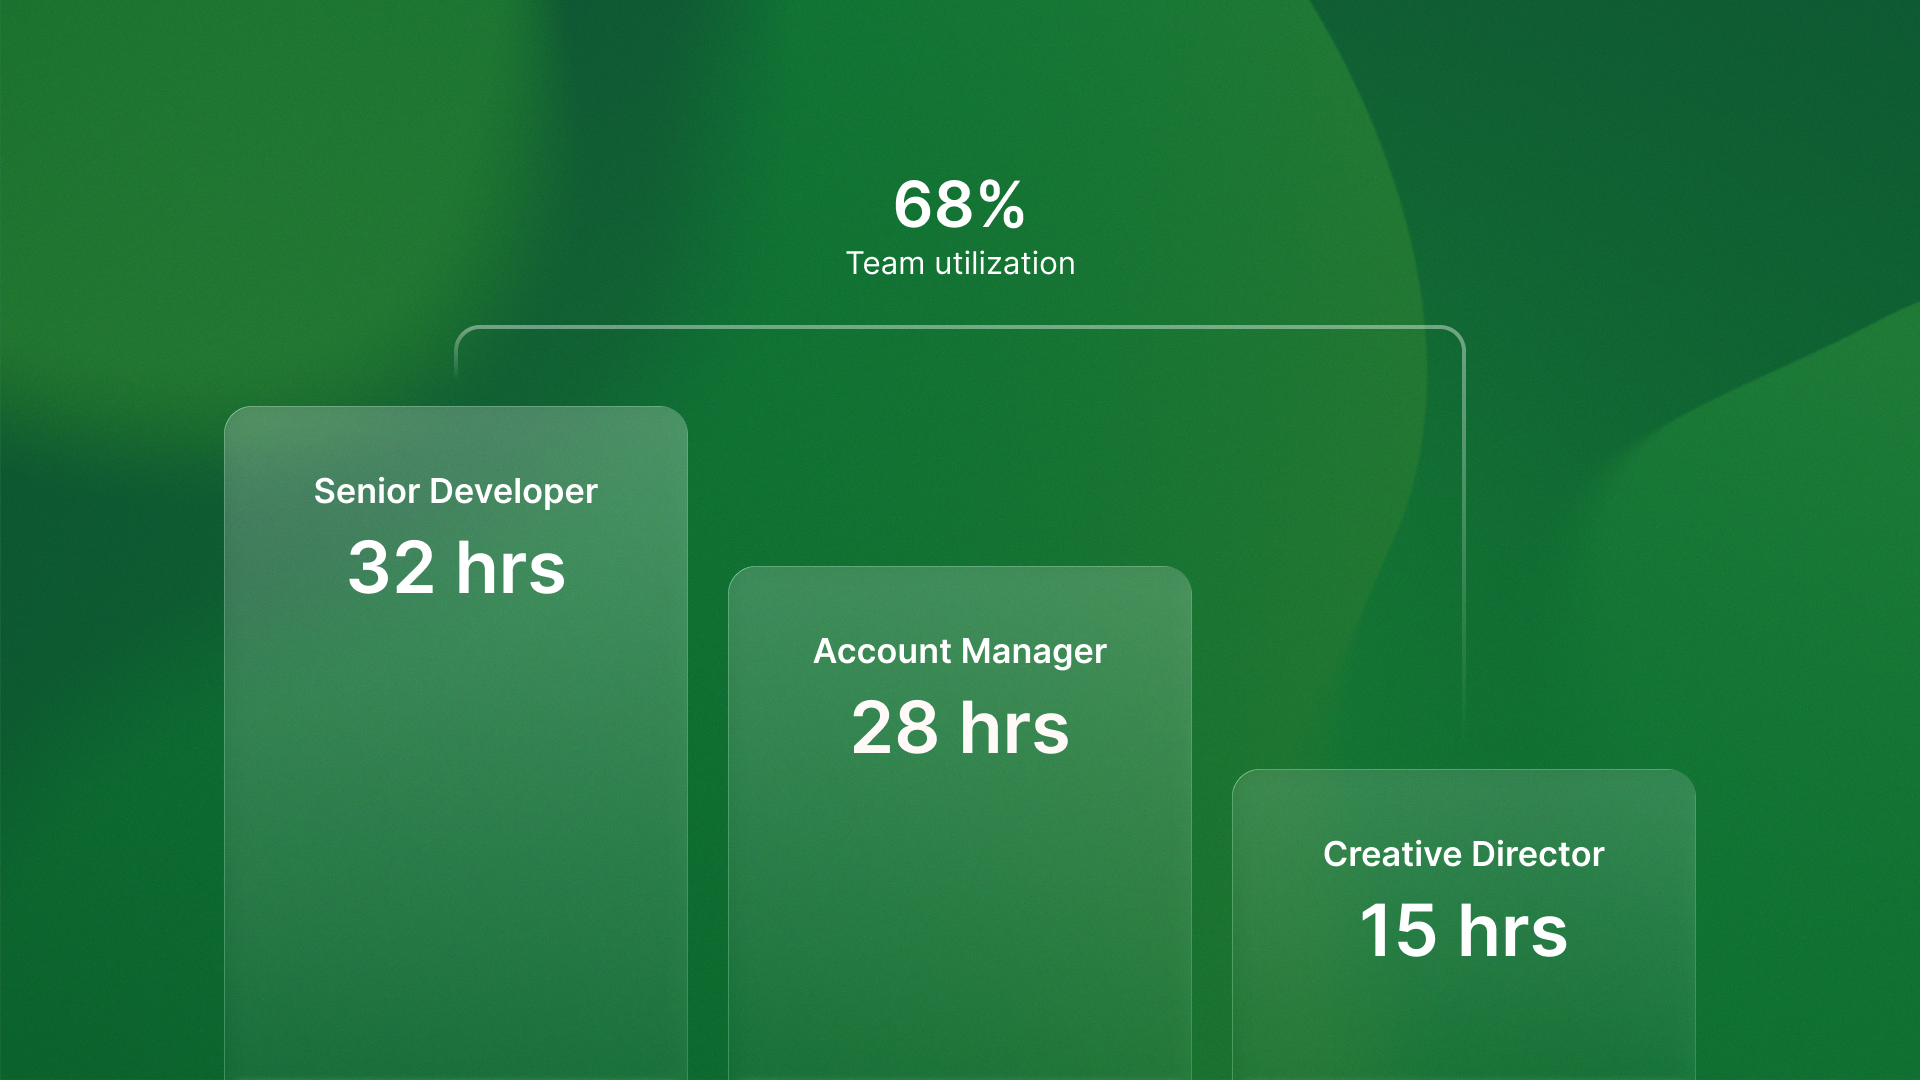
Billable utilization rate by role: Producers should hit 75-85% weekly. Agency-wide targets are about 50% to 60%. This includes non-billable staff like leadership and operations (Iota Finance Agency Profit Margins 2026). Most agencies track one blended number that hides critical problems. Your senior developers hit 92% utilization while your project managers sit at 38%.
Project-level gross margin in real-time: Revenue minus direct costs (developer salaries, contractor fees, tools). Not after the invoice clears. During execution. When you see margin dropping from 35% to 22% at the 60% completion mark, you still have options.
Cost variance against budget: Scope creep adding unplanned hours. Vendor costs exceeding estimates. Internal resources pulled onto the project without billing adjustments. Each variance is a corrective opportunity if you catch it while the project is live.
Why role-specific utilization matters
When you track one blended utilization number, you can't see the allocation problems killing your margins. Your design team bills 40 hours per week on low-margin client revisions while your strategists sit underutilized.
Platforms like Timecapsule surface utilization by role in real-time, showing allocation problems before they compound into margin erosion. The visibility allows you to rebalance workloads mid-project instead of discovering utilization gaps during quarterly reviews.
The math that changes everything
Small overhead cuts can boost profits a lot, but only if you act on cost variance during projects.
When agencies cut overhead from 30% to 25%, profit jumps 25% (TMetric via Swydo 2026). That 5-percentage-point overhead reduction sounds modest until you calculate the impact on a $75,000 project:
- 30% overhead: $22,500 in indirect costs
- 25% overhead: $18,750 in indirect costs
- Profit increase: $3,750 on a single project
But you can only capture that $3,750 by identifying and addressing overhead creep during execution. Post-project analysis tells you the overhead was too high after you've already paid the bills.
Cost variance tracking in action
Agencies using Timecapsule set project-level cost thresholds and receive alerts when actual costs trend above projected margins. The alerts prompt conversations with clients about scope changes. They also help teams discuss internal resource decisions. This happens before the variance becomes permanent.
Development agencies like Islands manage fractional CTO hours across multiple client projects using real-time profitability dashboards. They know which engagements are trending profitable at week two, not month three.
The competitive advantage in timing
Post-project profitability analysis isn't wrong. It's just too late.
You discover the $8,000 loss after the team has moved on. After the client relationship is set. After the operational decisions are permanent.
Real-time profitability tracking gives you the visibility to intervene while corrective action still matters:
- Week 3: Utilization drops to 62% on your senior team. You rebalance allocation before non-billable time compounds.
- Week 6: Project margin trends from 32% to 26%. You scope clarification meeting with the client catches requirement creep.
- Week 9: Cost variance shows $12,000 over budget with 3 weeks remaining. You adjust resource mix to protect margin.
Those interventions happen because you have visibility during execution. Not because you ran a better post-mortem.
Software teams like QA flow and ReachSocial track development time against feature budgets in real time. They catch scope growth before it uses up roadmap capacity.

The shift from analysis to prevention
The agencies stuck at 18-22% margins keep analyzing. The agencies at 25-32% margins keep preventing.
Analysis is a feature. Prevention is a competitive advantage.