.svg)
Why Remote Team Productivity Hinges on Transparent Profitability Data

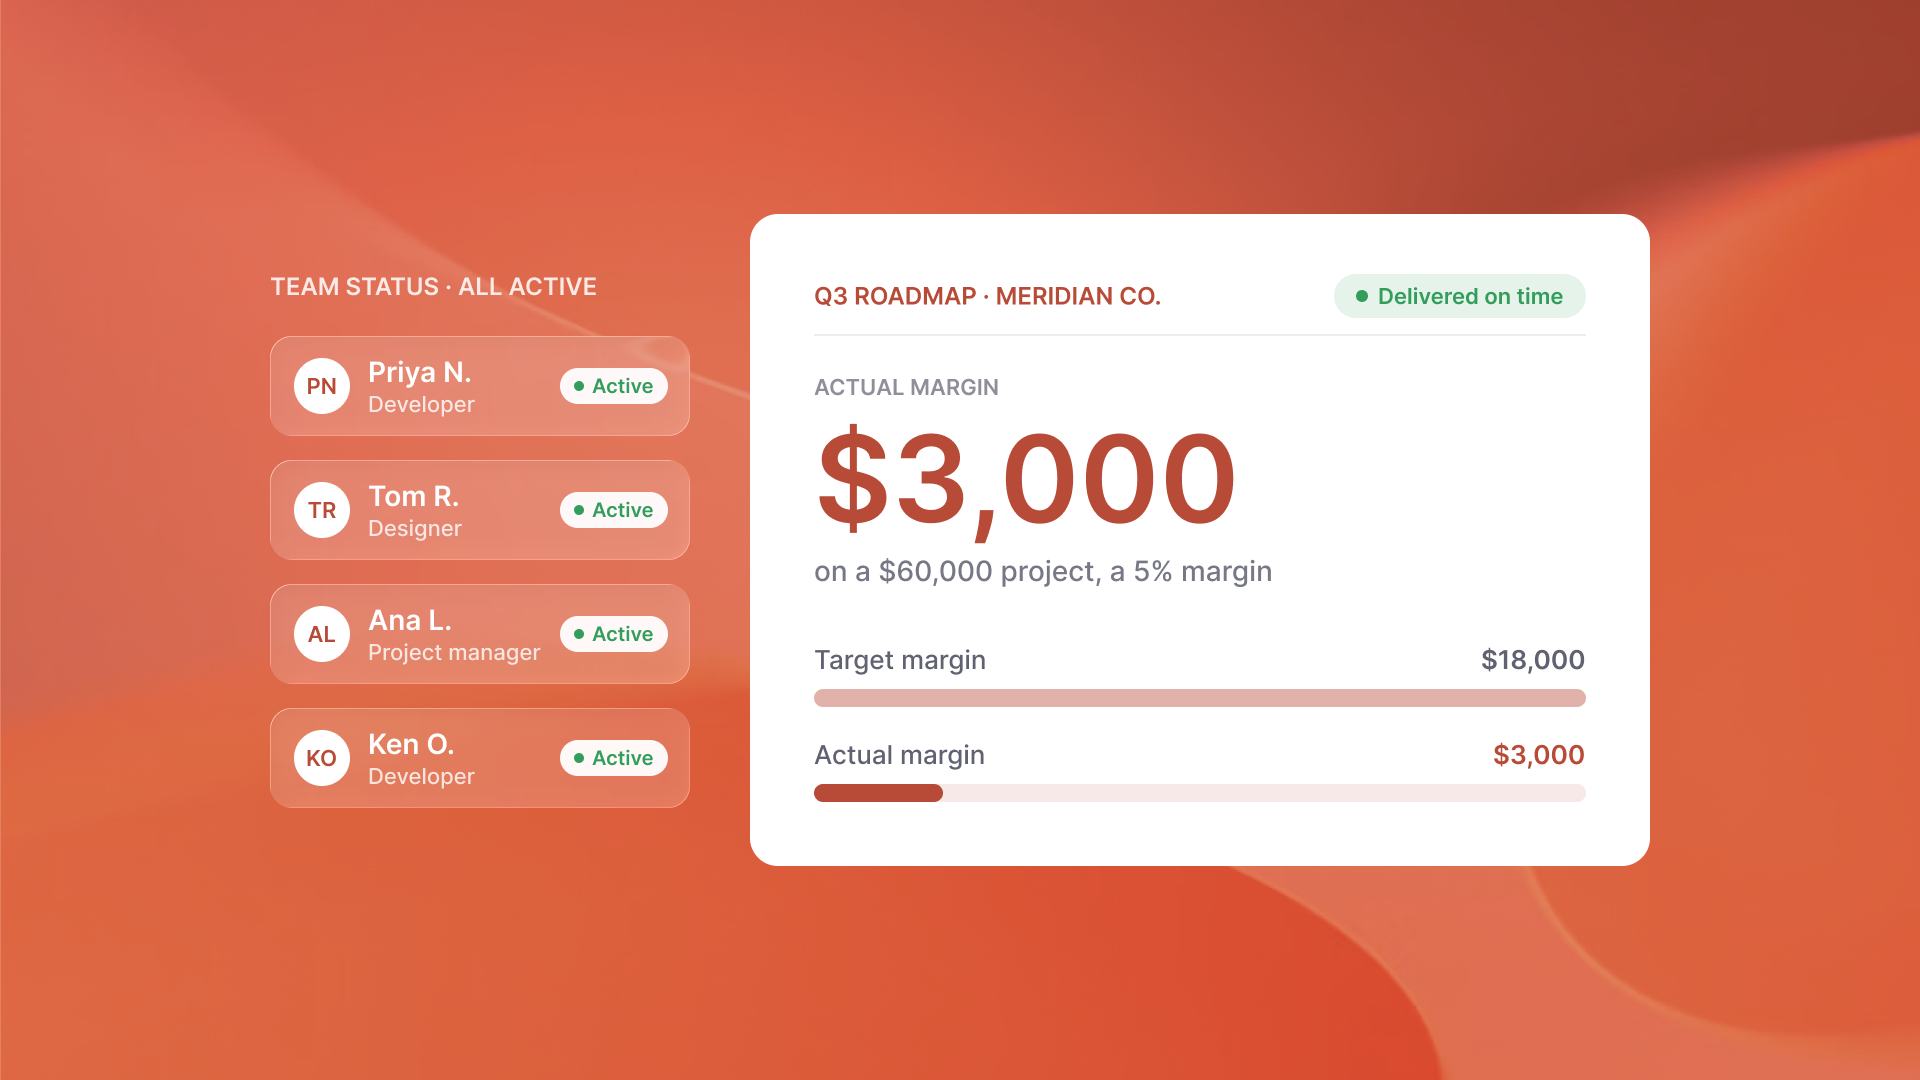
Your Slack channel is quiet and the office is empty, but your payroll is still running. You delivered the $60,000 Q3 roadmap on time and the client is happy. Then you calculate the actual project margin and realize you cleared $3,000 instead of $18,000. On the surface, remote team productivity looked high. In reality, you were hemorrhaging profit on scope creep. The math is brutal. Without linking daily output to actual business margins, you are not managing a team. You are just watching a cost center grow.
The activity trap: why remote team productivity monitoring fails
Traditional oversight signals, such as busy rooms or quick desk check-ins, disappear in remote settings. Many agency owners mistake a quiet Slack channel for slipped productivity. They respond with more check-ins and status pings, and eventually with surveillance-based tools. That constant interruption breaks the focus of their senior specialists, the people whose time is worth the most.
I have seen that these metrics are worse than useless. They encourage performative activity rather than business impact. They also fail to identify the high cost, low margin tasks that kill your profitability. To solve this, firms are moving toward modular agile frameworks that focus on output rather than availability. You need a system that measures what was delivered, not how many times a green light turned on.
Fragmented data and spreadsheet distortion
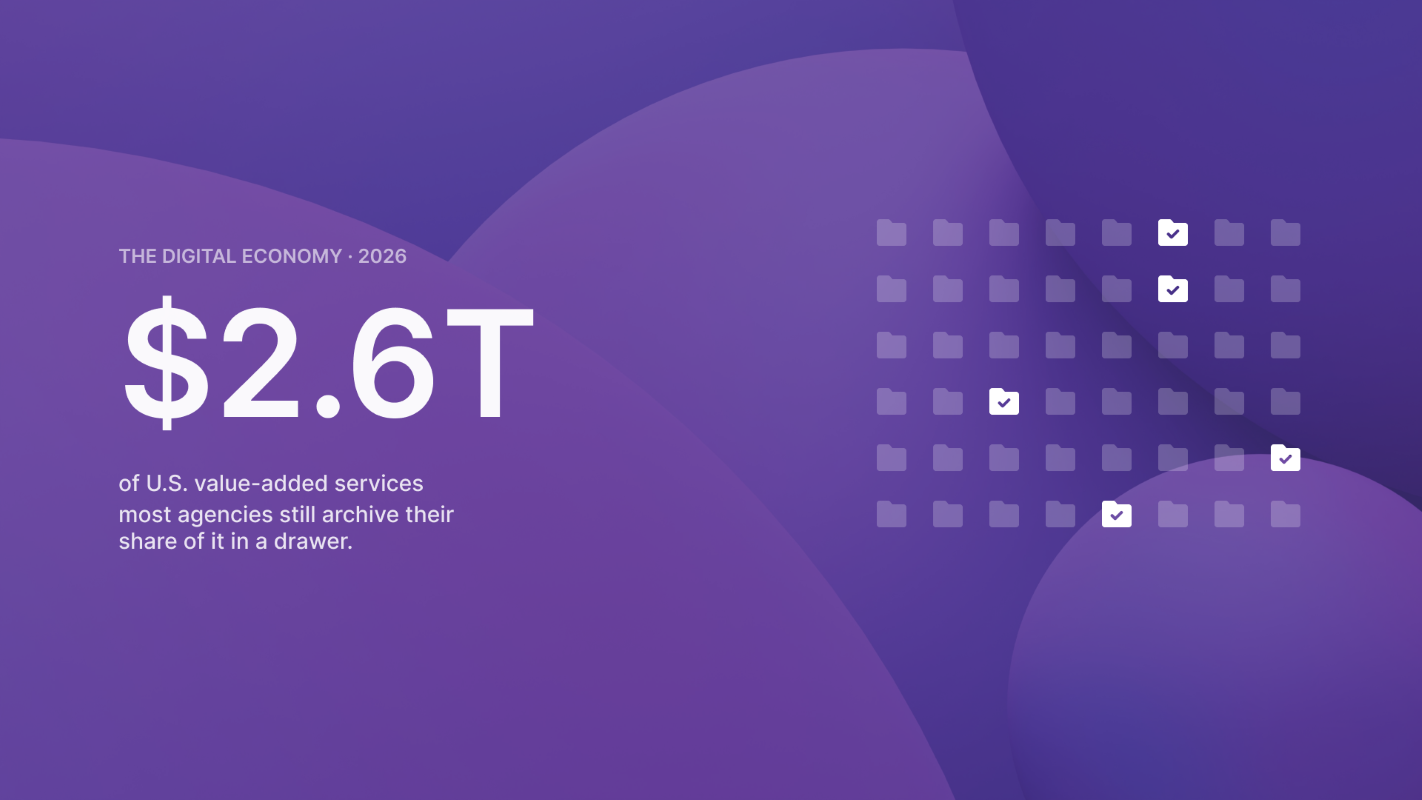
Remote data is typically fragmented across chat, video, and project management tools, creating siloed insights. Most agency leaders rely on manual spreadsheets to calculate their agency utilization rate, but these documents are often flawed. There's no consistent rule for what counts as available time. One sheet includes PTO and admin hours in the denominator, another leaves them out (Parallax). The result is a utilization number nobody can compare or trust. Worse, it says nothing about whether those billable hours actually covered the project's cost. A team can post healthy utilization on a project that's already underwater. Common spreadsheet distortions include:
- Counting available hours differently across people, roles, or months
- Logging hours without applying each person's cost rate, so time never translates into margin
- Ignoring the lag between work performed and revenue recognized
Shifting the lens: monitoring financial impact over hours
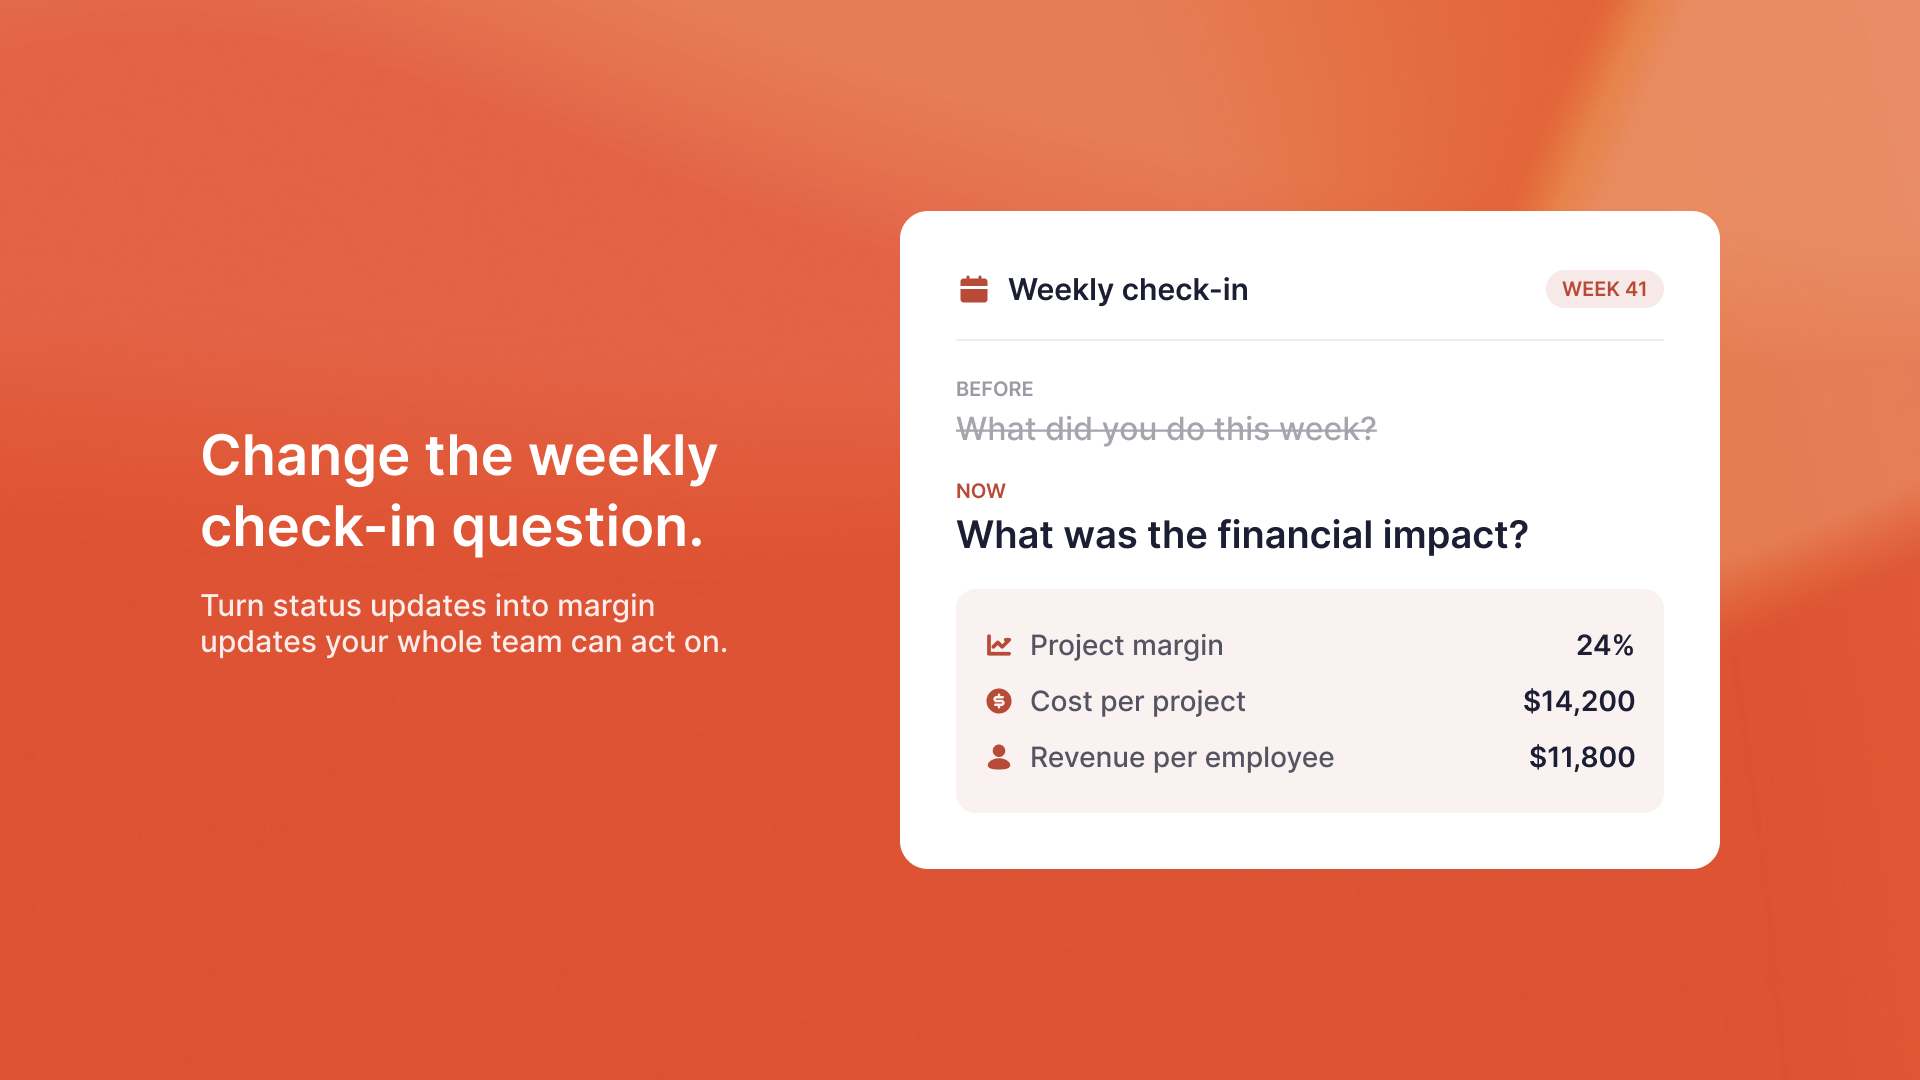
To effectively monitor remote team performance, you must shift your focus from activity to financial impact. This means tracking quantitative measures like cost per project and revenue per employee. These metrics provide a more accurate reading of productivity because they focus on business outcomes rather than location (Paymo). When you treat productivity as a financial metric, you can identify which projects drive growth and which merely consume resources.
Cost per project vs. hours logged
I analyzed how top performing agencies manage their budgets and found that they never rely on time logs alone. Tracking hours tells you how much time was spent, but it says nothing about the cost of that time relative to the project's fixed fee.
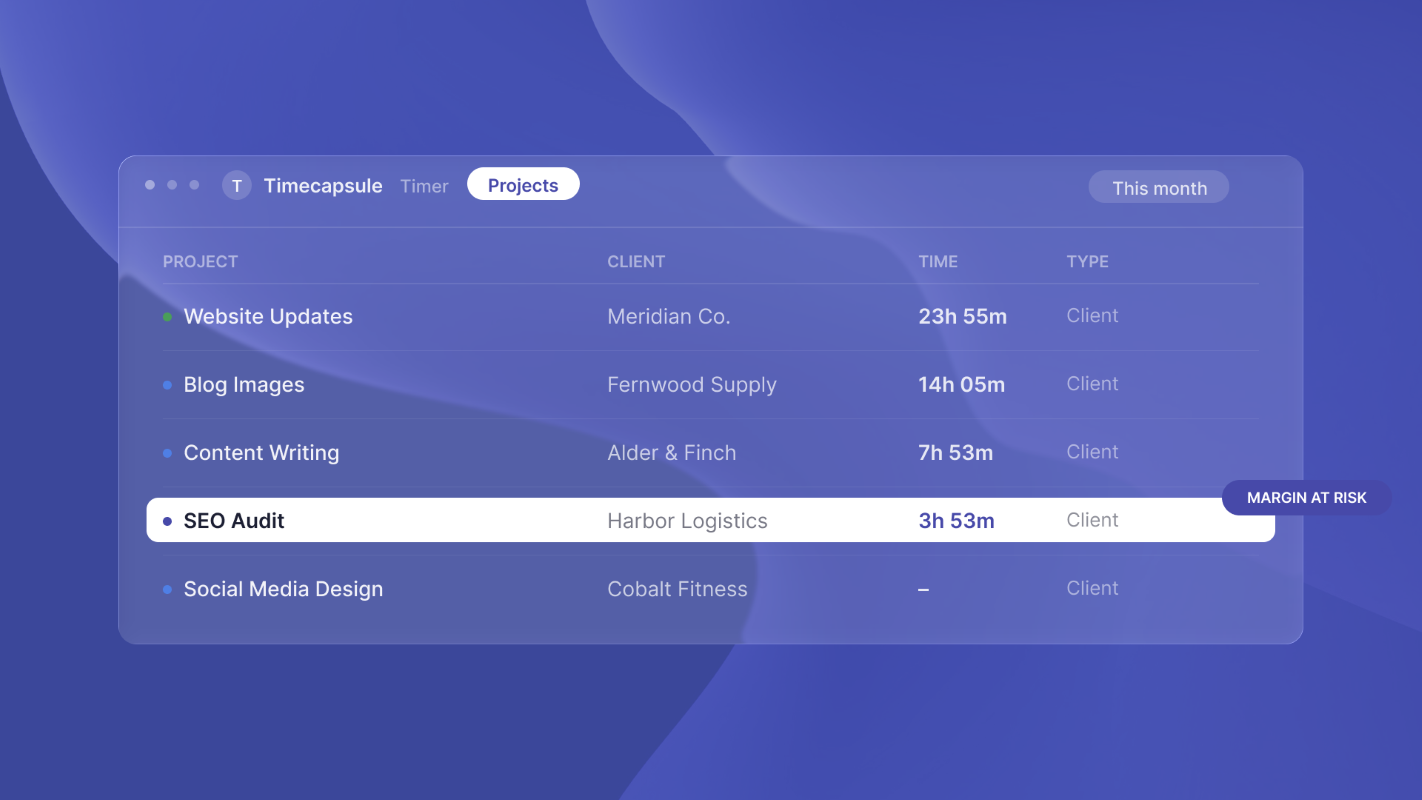
By implementing real time profitability visibility, you see the exact moment a developer's hourly rate eats through your remaining margin (Timecapsule). This allows you to catch scope creep during execution (Timecapsule). You won't have to wait to discover the loss weeks after the final invoice has been sent.
Revenue per employee as the ultimate KPI
Revenue per employee is the clearest indicator of your agency's efficiency. Companies that protect their net margin floors through rigorous tracking see significantly higher efficiency. According to Apploye, a company can perform 4.2x better with a 24% higher profit margin when changes are made according to efficiency metrics evaluation. This metric helps you decide when to hire and when to raise rates. It turns your workforce data into a strategic windshield instead of a rearview mirror.
Transparency as a performance multiplier
Shared operational intelligence is the practice of giving your remote team transparent access to the same billable utilization and profitability data that management uses. By adopting structured reporting frameworks, employees understand the financial impact of their work and can independently prioritize tasks that protect the agency's margins.
Shared operational intelligence
Transparency is a powerful motivator. When you share data about how billable utilization enables competitive salaries and new tool investments, the team stops resenting the clock. 87% of workers want their company to be transparent (Teamdeck).

Instead of relying on manual oversight, agencies are increasingly transitioning to autonomous financial systems to eliminate information lags. They start seeing themselves as partners in the agency's success. This culture of openness leads to higher engagement and a more resilient remote workforce.
Reducing bias through objective data
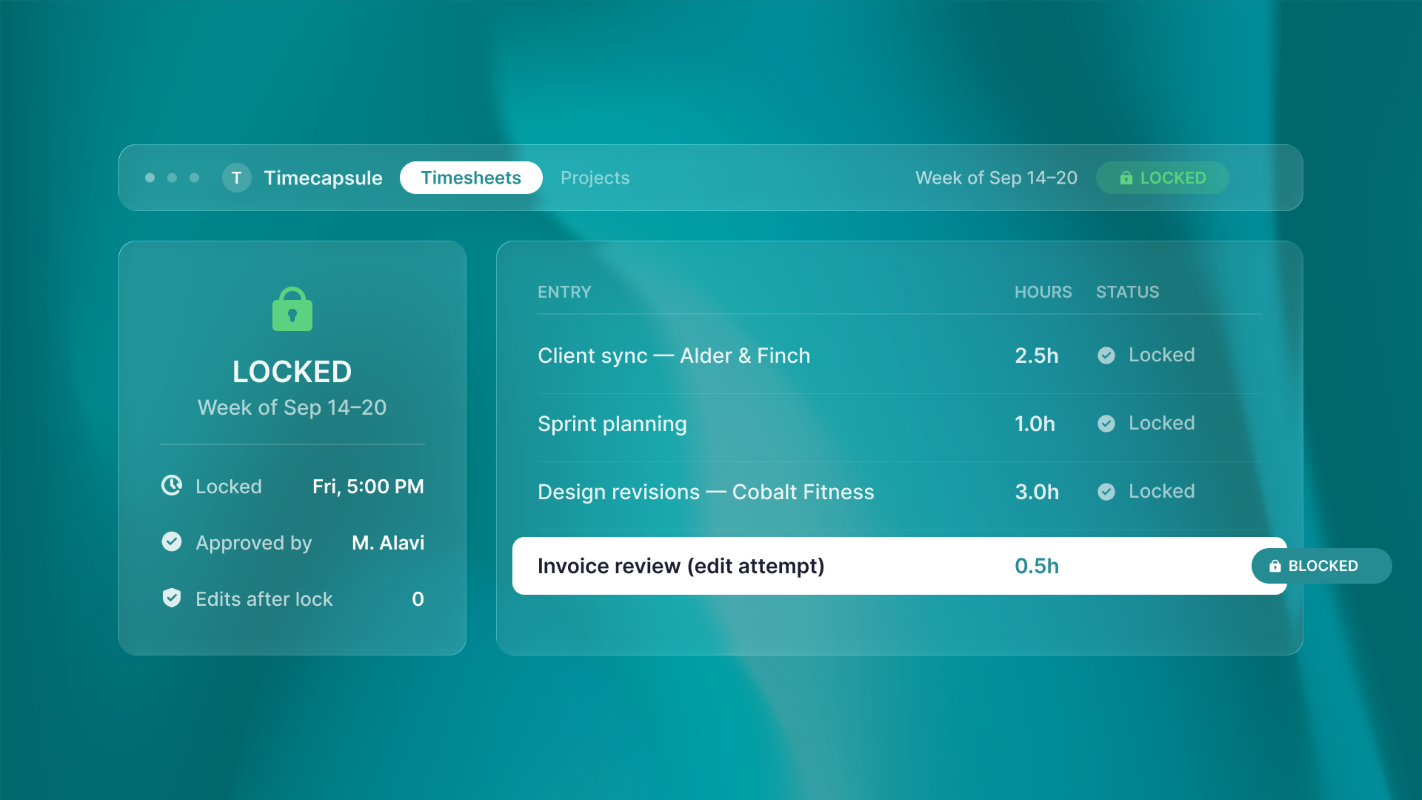
Remote evaluations are often plagued by personal bias because managers cannot see the day to day effort. By anchoring performance in objective team performance metrics and real time project execution data, you remove the out of sight, out of mind penalty (Timecapsule).
Defining success in concrete, observable terms makes productivity a system rather than a witnessed moment (Somewhere). This ensures that your best people are recognized for their output, regardless of their time zone or Slack activity level.
What to do next: building a profit-first remote culture
- Centralize your data into a real time profitability dashboard to eliminate siloed insights (Timecapsule).
- Deploy a project profitability tool to track margins at the task level.
- Define billable utilization targets for every role and share them transparently with the team.
- Shift your weekly check-ins from what did you do to what was the financial impact.
- Use SMART frameworks to connect individual tasks to project level gross margin goals.
Transitioning from reactive management to proactive profitability intelligence is the only way to scale a remote agency sustainably. By using margin protection tools, you turn your time logs into a strategic advantage (Timecapsule). This keeps your global team focused on the right priorities.
Optimize your team's performance and secure your data integrity by choosing to get started with Timecapsule today.